IBIS Calibration
The IBIS Calibration Team is repsonsible for maintaining an understanding of how the IBIS instrument is functioning and how its performance impacts scientific analysis of the data. The key aims of the calibration process are:
- Optimisation of instrument parameters.
- Measurement and verification of the instrument scientific performance.
- Determination of instrument characteristics as input for onboard and ground look-up tables.
- Provision of inputs to response matrix generation (in combination with modelling).
Off Axis Angle corrections
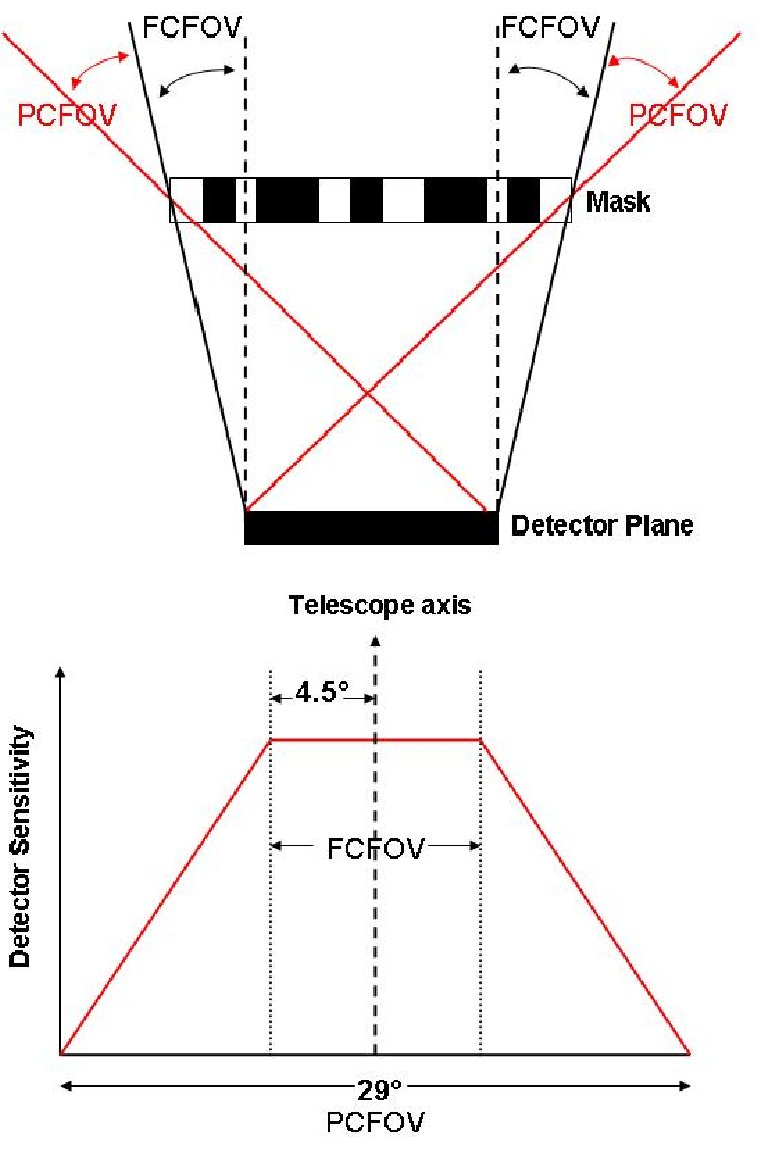
The IBIS detector is a coded mask imager in a cyclic configuration, i.e. the mask is larger than the detector plane. The advantage of this over a simple 'box' configuration is that it increases the size of the fully coded field of view; for IBIS this is 9x9 degrees. Any source which is within 4.5 degrees of the axis of the telescope will be fully coded; the partially coded field of view extends to 29x29 degrees and so some sources can have off axis angles (OAAs) of >15 degrees. The sensitivity of the instrument decreases from a constant in the fully coded field of view as sources move further and further into the partially coded field of view. This is a simple geometrical effect for which a correction is applied in the standard OSA software.
An additional effect was discovered and investigated here at Southampton. It was found that source fluxes were consistently lower when the source was at the edge of the field of view than when it was on-axis. This was attributed to flux absorption by the NOMEX-honeycomb support structure which is attached to the IBIS mask. As a source moves off axis it 'sees' more of he NOMEX and consequently more of its flux is absorbed.
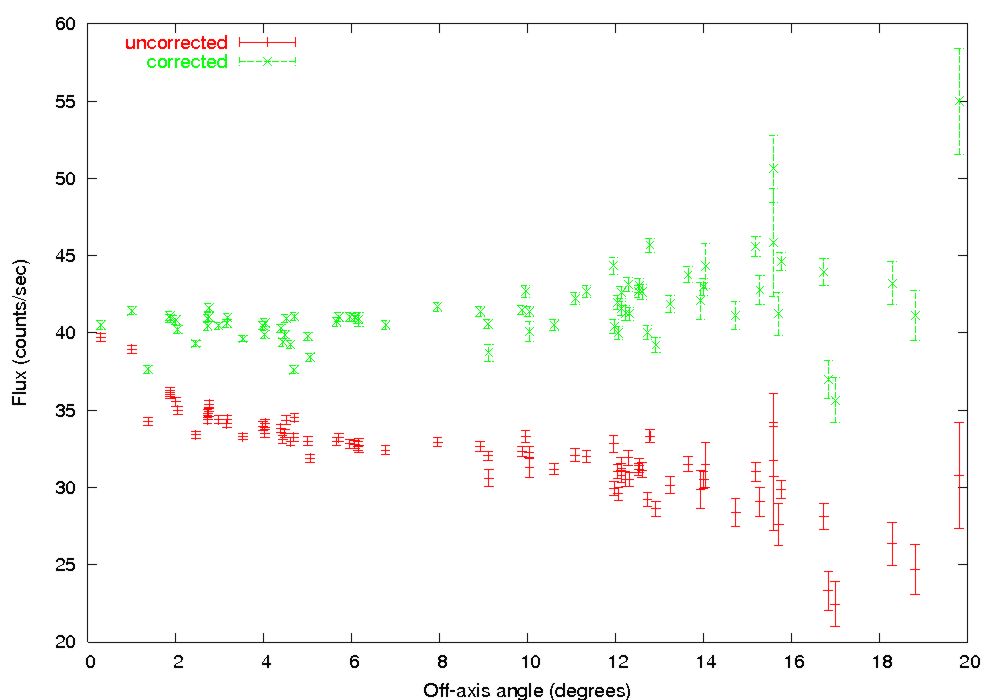
This effect is evident in the observed drop in flux from the Crab nebula as the ource moves further and further off-axis. This is shown in the plot to the left and is represented by the red points. This effect is energy dependent and has been empiraclly modelled by the Calibration Team using observations of the Crab Nebula at different off-axis angles. This correction has been delivered to the ISDC and has been incorporated into the standard OSA software since version 4.0. A corrected version of the Crab response is shown in green in the figure to the left.