INTEGRAL Galactic Bulge MonitoringRevolution 0350: Observation start 2005-08-25 = MJD 53607
Total Observation GTI = 12180 seconds
ISGRI
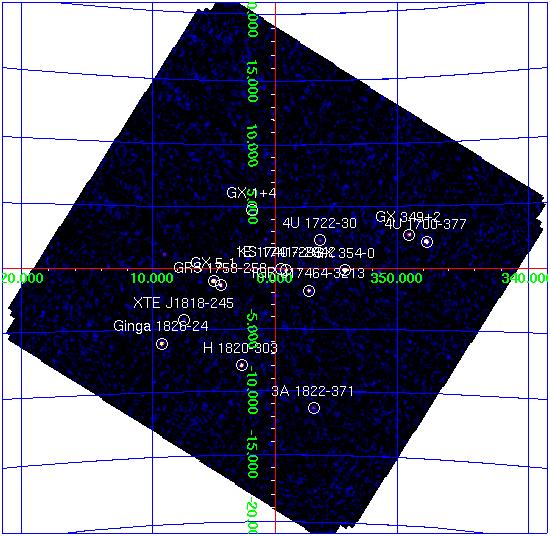
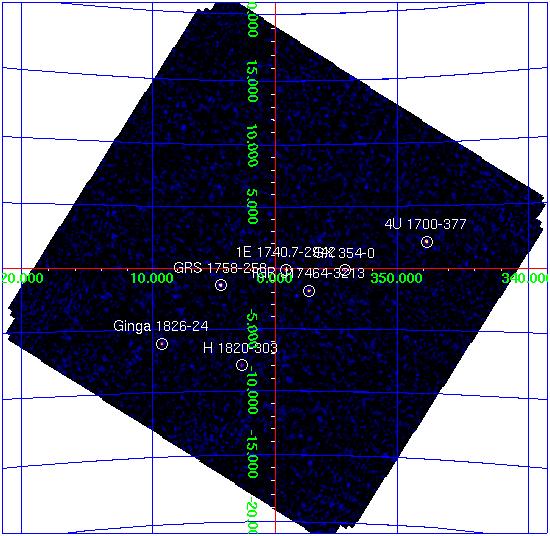
ISGRI significance mosaic images. Left: ISGRI 18-40 keV. Right: 40-100 keV
Sources detected > 10σ in each band are marked on the image. The table below lists the fitted position, and statistical positional uncertainty in arcmin returned by the mosaic step of OSA7, of all the sources detected in the 18 - 40 keV range (band A: 1 Crab ~ 206 cps ) and 40 - 100 keV range (band B: 1 Crab ~ 103 cps ) where available.
NOTES: The table is constructed from the isgri_mosa_res.fits file - fluxes in the mosaic output are known to be systematically ~10% lower than in the ScW light-curves (see known issues). The systematic noise increases towards the edge of the field of view and NEW sources < 6σ towards the border of the image may be spurious.
ISGRI Detected Sources 18-40 keV (A) and 40-100 keV (B)
Source Name             RA       dec   +/-    l        b     A(cps)  +/-   sig  B(cps)  +/-   sig
==================== ========  ======= === ======== ======== ====== ===== ===== ====== ===== =====
GX 5-1                270.289  -25.080 0.6    5.078   -1.023   18.2  0.31  59.2    0.0  0.00   0.0
4U 1700-377           256.001  -37.844 0.6  347.762   +2.164   35.1  0.63  56.0   11.0  0.47  23.3
GRS 1758-258          270.298  -25.743 0.8    4.507   -1.358   13.4  0.32  41.5    8.3  0.26  32.4
GX 354-0              262.997  -33.838 0.8  354.303   -0.157   13.2  0.32  41.2    3.7  0.25  14.7
H 1820-303            275.917  -30.361 0.9    2.788   -7.912   16.2  0.44  36.6    3.9  0.34  11.6
Ginga 1826-24         277.369  -23.800 1.0    9.270   -6.091   17.3  0.56  30.6    6.7  0.42  15.9
1E 1740.7-2942        265.996  -29.739 1.1  359.129   -0.116    7.7  0.28  27.0    5.6  0.23  23.8
IGR J17464-3213       266.557  -32.235 1.1  357.250   -1.828    8.1  0.30  27.3    4.1  0.24  16.9
GX 349+2              256.448  -36.426 1.3  349.107   +2.738   12.8  0.55  23.1    0.0  0.00   0.0
KS 1741-293           266.213  -29.336 0.0  359.571   -0.065    4.0  0.00  14.7    1.8  0.00   8.2
GX 1+4                263.028  -24.737 1.7    1.953   +4.785    5.0  0.31  16.0    0.0  0.00   0.0
3A 1822-371           276.492  -37.111 2.4  356.862  -11.327    6.5  0.58  11.3    0.0  0.00   0.0
4U 1722-30            261.884  -30.801 2.4  356.319   +2.301    3.8  0.34  11.1    1.2  0.00   4.5
IGR J17252-3616       261.285  -36.294 2.8  351.482   -0.352    4.1  0.44   9.4    0.0  0.00   0.0
GX 9+1                270.379  -20.551 2.7    9.055   +1.148    4.2  0.43   9.9    0.0  0.00   0.0
SLX 1744-299_300      266.880  -30.051 2.9  359.262   -0.932    2.6  0.28   9.0    1.0  0.23   4.2
XTE J1818-245         274.616  -24.537 2.5    7.450   -4.202    4.5  0.43  10.6    2.1  0.33   6.3
SLX 1735-269          264.569  -26.975 3.3    0.811   +2.412    2.7  0.35   7.8    1.4  0.29   4.8
GX 13+1               273.610  -17.168 3.8   13.497   +0.120    5.1  0.77   6.6    0.0  0.00   0.0
MXB 1730-335          263.350  -33.402 4.0  354.829   -0.165    1.9  0.31   6.3    0.0  0.00   0.0
GX 3+1                266.997  -26.588 4.0    2.279   +0.771    2.0  0.32   6.3    0.0  0.00   0.0
4U 1735-444           264.782  -44.492 4.1  346.033   -7.039   21.8  3.60   6.1    0.0  0.00   0.0
OAO 1657-415          255.173  -41.661 4.3  344.351   +0.335    7.9  1.37   5.8    0.0  0.00   0.0
3A 1728-169           262.970  -16.970 5.1    8.524   +9.004    3.3  0.68   4.8    0.0  0.00   0.0
QSO B1730-130         263.305  -13.160 4.9   11.986  +10.734   15.3  3.02   5.1    0.0  0.00   0.0
GX 17+2               273.959  -14.081 5.7   16.371   +1.296    8.9  2.08   4.3    0.0  0.00   0.0
IGR J17456-2901       266.402  -28.925 0.0    0.008   +0.008    1.0  0.00   3.8    0.0  0.00   0.0
JEM-X
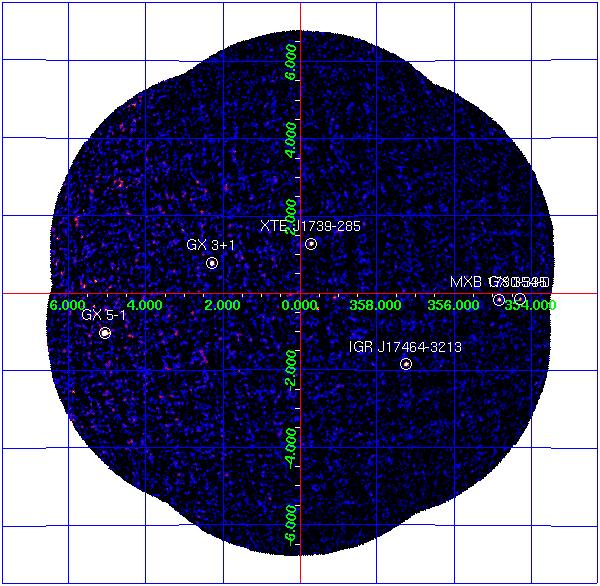
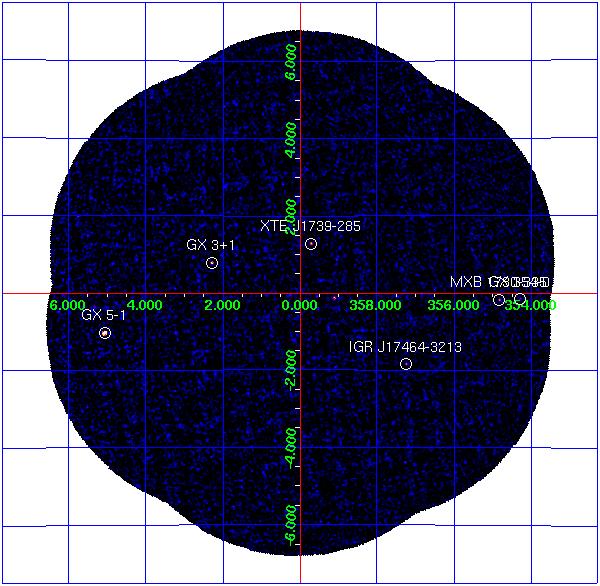
JEM-X significance mosaic images. Left: 3-10 keV. Right: 10-25 keV.
Note: Sources labelled were detected with in the 3-10 keV image > 10σ and are listed in the table below. Fluxes are extracted at the known catalogue position of the source (i.e. no fitting of the source position is done), with mosaic_spec, in two bands: A = 3-10 keV (1 Crab ~ 88 cps); B = 10-25 keV (1 Crab ~ 32 cps).
NOTES: Fluxes for light curves are extracted from the images using mosaic_spec; The object marked as SLX 1744-299_300 is used to indicate two low-mass x-ray binaries separated by 2.7 arcminutes, SLX 1744-299 and SLX 1744-300; the position for SLX 1744-299 is used, although it can not be ruled out that SLX 1744-300 may dominate the emission some of the time.
JEM-X Detected Sources in 3-10 keV (A) and 10-25 keV (B).
Source Name             RA      dec       l        b     A(cps)  +/-  B(cps)  +/-
==================== ======== ======== ======== ======== ====== ===== ====== =====
XTE J1739-285         264.975  -28.496  359.714   +1.298    5.9  0.41    1.1  0.27
MXB 1730-335          263.350  -33.388  354.841   -0.158   12.0  1.30    2.7  0.85
GX 354-0              262.989  -33.835  354.302   -0.150    8.5  1.56    2.0  0.97
GX 3+1                266.983  -26.564    2.294   +0.794   13.4  0.54    1.7  0.30
GX 5-1                270.284  -25.079    5.077   -1.019  122.9  2.44   22.5  1.24
IGR J17464-3213       266.567  -32.229  357.260   -1.832    7.8  0.59    1.0  0.34
Go back to Bulge home page
Revolution 0350: Observation start 2005-08-25 = MJD 53607
Total Observation GTI = 12180 seconds
ISGRI
ISGRI significance mosaic images. Left: ISGRI 18-40 keV. Right: 40-100 keV
Sources detected > 10σ in each band are marked on the image. The table below lists the fitted position, and statistical positional uncertainty in arcmin returned by the mosaic step of OSA7, of all the sources detected in the 18 - 40 keV range (band A: 1 Crab ~ 206 cps ) and 40 - 100 keV range (band B: 1 Crab ~ 103 cps ) where available.
NOTES: The table is constructed from the isgri_mosa_res.fits file - fluxes in the mosaic output are known to be systematically ~10% lower than in the ScW light-curves (see known issues). The systematic noise increases towards the edge of the field of view and NEW sources < 6σ towards the border of the image may be spurious.
ISGRI Detected Sources 18-40 keV (A) and 40-100 keV (B)
Source Name RA dec +/- l b A(cps) +/- sig B(cps) +/- sig ==================== ======== ======= === ======== ======== ====== ===== ===== ====== ===== ===== GX 5-1 270.289 -25.080 0.6 5.078 -1.023 18.2 0.31 59.2 0.0 0.00 0.0 4U 1700-377 256.001 -37.844 0.6 347.762 +2.164 35.1 0.63 56.0 11.0 0.47 23.3 GRS 1758-258 270.298 -25.743 0.8 4.507 -1.358 13.4 0.32 41.5 8.3 0.26 32.4 GX 354-0 262.997 -33.838 0.8 354.303 -0.157 13.2 0.32 41.2 3.7 0.25 14.7 H 1820-303 275.917 -30.361 0.9 2.788 -7.912 16.2 0.44 36.6 3.9 0.34 11.6 Ginga 1826-24 277.369 -23.800 1.0 9.270 -6.091 17.3 0.56 30.6 6.7 0.42 15.9 1E 1740.7-2942 265.996 -29.739 1.1 359.129 -0.116 7.7 0.28 27.0 5.6 0.23 23.8 IGR J17464-3213 266.557 -32.235 1.1 357.250 -1.828 8.1 0.30 27.3 4.1 0.24 16.9 GX 349+2 256.448 -36.426 1.3 349.107 +2.738 12.8 0.55 23.1 0.0 0.00 0.0 KS 1741-293 266.213 -29.336 0.0 359.571 -0.065 4.0 0.00 14.7 1.8 0.00 8.2 GX 1+4 263.028 -24.737 1.7 1.953 +4.785 5.0 0.31 16.0 0.0 0.00 0.0 3A 1822-371 276.492 -37.111 2.4 356.862 -11.327 6.5 0.58 11.3 0.0 0.00 0.0 4U 1722-30 261.884 -30.801 2.4 356.319 +2.301 3.8 0.34 11.1 1.2 0.00 4.5 IGR J17252-3616 261.285 -36.294 2.8 351.482 -0.352 4.1 0.44 9.4 0.0 0.00 0.0 GX 9+1 270.379 -20.551 2.7 9.055 +1.148 4.2 0.43 9.9 0.0 0.00 0.0 SLX 1744-299_300 266.880 -30.051 2.9 359.262 -0.932 2.6 0.28 9.0 1.0 0.23 4.2 XTE J1818-245 274.616 -24.537 2.5 7.450 -4.202 4.5 0.43 10.6 2.1 0.33 6.3 SLX 1735-269 264.569 -26.975 3.3 0.811 +2.412 2.7 0.35 7.8 1.4 0.29 4.8 GX 13+1 273.610 -17.168 3.8 13.497 +0.120 5.1 0.77 6.6 0.0 0.00 0.0 MXB 1730-335 263.350 -33.402 4.0 354.829 -0.165 1.9 0.31 6.3 0.0 0.00 0.0 GX 3+1 266.997 -26.588 4.0 2.279 +0.771 2.0 0.32 6.3 0.0 0.00 0.0 4U 1735-444 264.782 -44.492 4.1 346.033 -7.039 21.8 3.60 6.1 0.0 0.00 0.0 OAO 1657-415 255.173 -41.661 4.3 344.351 +0.335 7.9 1.37 5.8 0.0 0.00 0.0 3A 1728-169 262.970 -16.970 5.1 8.524 +9.004 3.3 0.68 4.8 0.0 0.00 0.0 QSO B1730-130 263.305 -13.160 4.9 11.986 +10.734 15.3 3.02 5.1 0.0 0.00 0.0 GX 17+2 273.959 -14.081 5.7 16.371 +1.296 8.9 2.08 4.3 0.0 0.00 0.0 IGR J17456-2901 266.402 -28.925 0.0 0.008 +0.008 1.0 0.00 3.8 0.0 0.00 0.0
JEM-X
JEM-X significance mosaic images. Left: 3-10 keV. Right: 10-25 keV.
Note: Sources labelled were detected with in the 3-10 keV image > 10σ and are listed in the table below. Fluxes are extracted at the known catalogue position of the source (i.e. no fitting of the source position is done), with mosaic_spec, in two bands: A = 3-10 keV (1 Crab ~ 88 cps); B = 10-25 keV (1 Crab ~ 32 cps).
NOTES: Fluxes for light curves are extracted from the images using mosaic_spec; The object marked as SLX 1744-299_300 is used to indicate two low-mass x-ray binaries separated by 2.7 arcminutes, SLX 1744-299 and SLX 1744-300; the position for SLX 1744-299 is used, although it can not be ruled out that SLX 1744-300 may dominate the emission some of the time.
JEM-X Detected Sources in 3-10 keV (A) and 10-25 keV (B).
Source Name RA dec l b A(cps) +/- B(cps) +/- ==================== ======== ======== ======== ======== ====== ===== ====== ===== XTE J1739-285 264.975 -28.496 359.714 +1.298 5.9 0.41 1.1 0.27 MXB 1730-335 263.350 -33.388 354.841 -0.158 12.0 1.30 2.7 0.85 GX 354-0 262.989 -33.835 354.302 -0.150 8.5 1.56 2.0 0.97 GX 3+1 266.983 -26.564 2.294 +0.794 13.4 0.54 1.7 0.30 GX 5-1 270.284 -25.079 5.077 -1.019 122.9 2.44 22.5 1.24 IGR J17464-3213 266.567 -32.229 357.260 -1.832 7.8 0.59 1.0 0.34
Go back to Bulge home page