INTEGRAL Galactic Bulge MonitoringRevolution 0544: Observation start 1999-12-31 = MJD 51544
Total Observation GTI = 10281 seconds
ISGRI
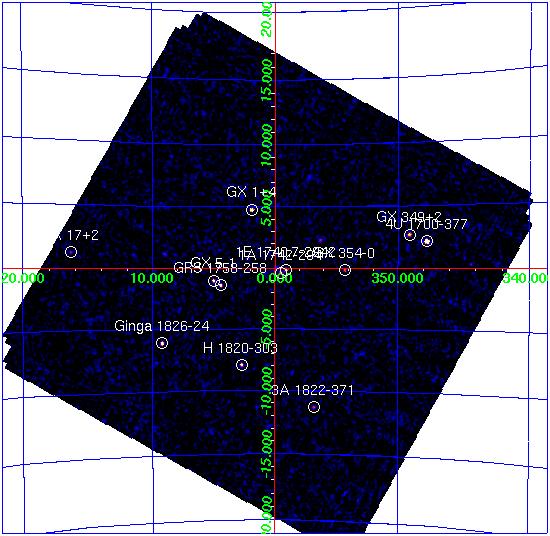
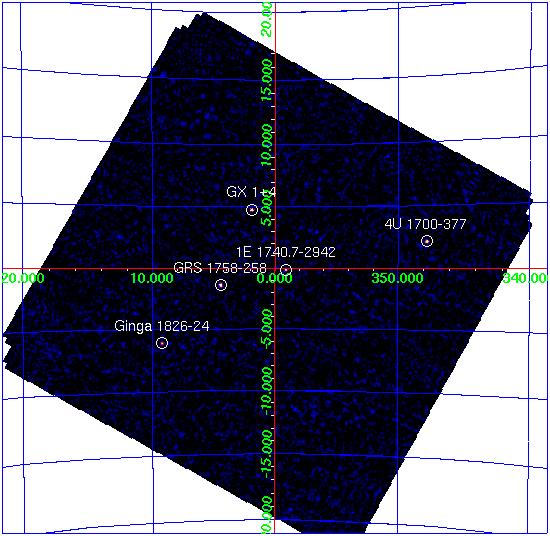
ISGRI significance mosaic images. Left: ISGRI 18-40 keV. Right: 40-100 keV
Sources detected > 10σ in each band are marked on the image. The table below lists the fitted position, and statistical positional uncertainty in arcmin returned by the mosaic step of OSA7, of all the sources detected in the 18 - 40 keV range (band A: 1 Crab ~ 206 cps ) and 40 - 100 keV range (band B: 1 Crab ~ 103 cps ) where available.
NOTES: The table is constructed from the isgri_mosa_res.fits file - fluxes in the mosaic output are known to be systematically ~10% lower than in the ScW light-curves (see known issues). The systematic noise increases towards the edge of the field of view and NEW sources < 6σ towards the border of the image may be spurious.
ISGRI Detected Sources 18-40 keV (A) and 40-100 keV (B)
Source Name             RA       dec   +/-    l        b     A(cps)  +/-   sig  B(cps)  +/-   sig
==================== ========  ======= === ======== ======== ====== ===== ===== ====== ===== =====
4U 1700-377           255.991  -37.842 0.6  347.759   +2.172   50.1  0.83  60.5   13.5  0.63  21.6
GX 1+4                263.005  -24.744 0.7    1.936   +4.799   19.9  0.43  46.4    0.0  0.00   0.0
GRS 1758-258          270.310  -25.750 1.0    4.505   -1.371   11.9  0.38  31.5    9.2  0.31  29.6
Ginga 1826-24         277.360  -23.804 1.0    9.263   -6.085   16.7  0.56  29.7    7.5  0.44  16.8
1E 1740.7-2942        265.986  -29.739 1.1  359.125   -0.109    9.8  0.36  26.9    6.6  0.30  21.9
GX 5-1                270.280  -25.088 1.3    5.068   -1.020    9.6  0.40  23.7    0.0  0.00   0.0
H 1820-303            275.905  -30.364 1.3    2.781   -7.904   10.7  0.46  23.4    0.0  0.00   0.0
GX 349+2              256.483  -36.411 1.5  349.136   +2.725   12.6  0.66  19.1    0.0  0.00   0.0
1A 1742-294           266.486  -29.506 1.7  359.551   -0.357    5.7  0.34  16.8    1.7  0.00   6.0
GX 354-0              262.996  -33.834 2.0  354.306   -0.155    5.7  0.41  13.9    0.0  0.00   0.0
3A 1822-371           276.420  -37.114 2.1  356.834  -11.277    7.5  0.59  12.7    1.9  0.47   4.1
4U 1722-30            261.859  -30.812 3.0  356.298   +2.313    3.4  0.38   8.8    1.5  0.30   5.1
GX 17+2               273.989  -14.043 2.6   16.419   +1.289   23.7  2.34  10.1    0.0  0.00   0.0
OAO 1657-415          255.181  -41.664 2.9  344.353   +0.328   17.4  1.94   9.0    0.0  0.00   0.0
GX 3+1                266.968  -26.565 2.9    2.285   +0.805    2.9  0.32   8.9    0.0  0.00   0.0
GRS 1741.9-2853       266.266  -28.959 0.0  359.917   +0.092    2.5  0.00   7.3    1.1  0.28   4.0
GX 9+1                270.350  -20.551 3.4    9.042   +1.170    3.6  0.47   7.5    0.0  0.00   0.0
SLX 1735-269          264.602  -27.036 3.9    0.775   +2.355    2.1  0.33   6.5    1.2  0.26   4.5
SLX 1744-299_300      266.859  -29.997 4.1  359.298   -0.889    2.2  0.35   6.2    0.0  0.00   0.0
3A 1728-169           262.920  -16.987 4.1    8.484   +9.036    5.7  0.93   6.1    0.0  0.00   0.0
XB 1832-330           278.876  -32.986 4.5    1.515  -11.326    3.3  0.59   5.6    0.0  0.00   0.0
HETE J1900.1-2455     284.962  -24.856 5.9   11.337  -12.786   10.1  2.42   4.1    0.0  0.00   0.0
SLX 1737-282          265.094  -28.277 4.9  359.955   +1.325    1.8  0.35   5.0    0.0  0.00   0.0
AX J1749.1-2733       267.348  -27.490 4.8    1.668   +0.038    1.8  0.34   5.2    0.0  0.00   0.0
4U 1735-444           264.738  -44.418 5.0  346.080   -6.974   14.6  2.95   5.0    0.0  0.00   0.0
IGR J17497-2821       267.302  -28.391 6.2    0.874   -0.391    1.3  0.00   3.9    0.0  0.00   0.0
JEM-X
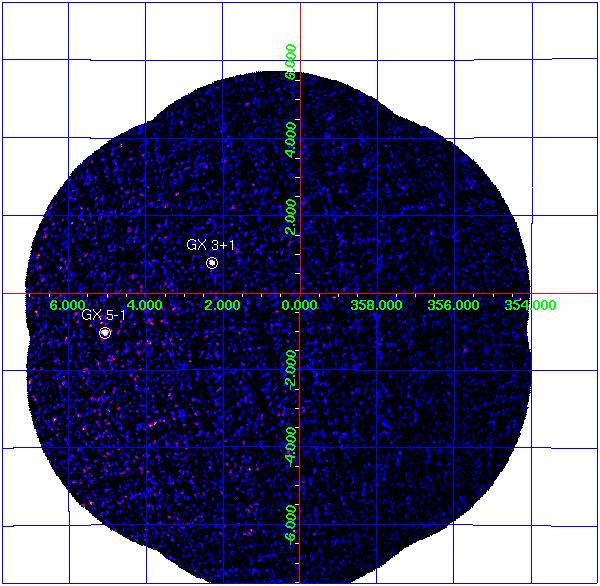
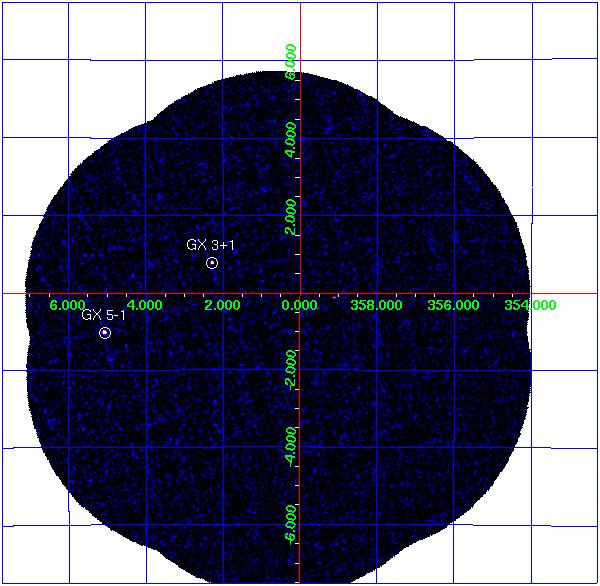
JEM-X significance mosaic images. Left: 3-10 keV. Right: 10-25 keV.
Note: Sources labelled were detected with in the 3-10 keV image > 5σ and are listed in the table below. Fluxes are extracted at the known catalogue position of the source (i.e. no fitting of the source position is done), with mosaic_spec, in two bands: A = 3-10 keV (1 Crab ~ 88 cps); B = 10-25 keV (1 Crab ~ 32 cps).
NOTE: The object marked as SLX 1744-299_300 is used to indicate two low-mass x-ray binaries separated by 2.7 arcminutes, SLX 1744-299 and SLX 1744-300; the position for SLX 1744-299 is used, although it can not be ruled out that SLX 1744-300 may dominate the emission some of the time.
JEM-X Detected Sources in 3-10 keV (A) and 10-25 keV (B).
Source Name             RA      dec       l        b     A(cps)  +/-  B(cps)  +/-
==================== ======== ======== ======== ======== ====== ===== ====== =====
GX 3+1                266.983  -26.564    2.294   +0.794   31.3  0.72    4.3  0.36
GX 5-1                270.284  -25.079    5.077   -1.019   96.0  1.74   10.8  0.73
Go back to Bulge home page
Revolution 0544: Observation start 1999-12-31 = MJD 51544
Total Observation GTI = 10281 seconds
ISGRI
ISGRI significance mosaic images. Left: ISGRI 18-40 keV. Right: 40-100 keV
Sources detected > 10σ in each band are marked on the image. The table below lists the fitted position, and statistical positional uncertainty in arcmin returned by the mosaic step of OSA7, of all the sources detected in the 18 - 40 keV range (band A: 1 Crab ~ 206 cps ) and 40 - 100 keV range (band B: 1 Crab ~ 103 cps ) where available.
NOTES: The table is constructed from the isgri_mosa_res.fits file - fluxes in the mosaic output are known to be systematically ~10% lower than in the ScW light-curves (see known issues). The systematic noise increases towards the edge of the field of view and NEW sources < 6σ towards the border of the image may be spurious.
ISGRI Detected Sources 18-40 keV (A) and 40-100 keV (B)
Source Name RA dec +/- l b A(cps) +/- sig B(cps) +/- sig ==================== ======== ======= === ======== ======== ====== ===== ===== ====== ===== ===== 4U 1700-377 255.991 -37.842 0.6 347.759 +2.172 50.1 0.83 60.5 13.5 0.63 21.6 GX 1+4 263.005 -24.744 0.7 1.936 +4.799 19.9 0.43 46.4 0.0 0.00 0.0 GRS 1758-258 270.310 -25.750 1.0 4.505 -1.371 11.9 0.38 31.5 9.2 0.31 29.6 Ginga 1826-24 277.360 -23.804 1.0 9.263 -6.085 16.7 0.56 29.7 7.5 0.44 16.8 1E 1740.7-2942 265.986 -29.739 1.1 359.125 -0.109 9.8 0.36 26.9 6.6 0.30 21.9 GX 5-1 270.280 -25.088 1.3 5.068 -1.020 9.6 0.40 23.7 0.0 0.00 0.0 H 1820-303 275.905 -30.364 1.3 2.781 -7.904 10.7 0.46 23.4 0.0 0.00 0.0 GX 349+2 256.483 -36.411 1.5 349.136 +2.725 12.6 0.66 19.1 0.0 0.00 0.0 1A 1742-294 266.486 -29.506 1.7 359.551 -0.357 5.7 0.34 16.8 1.7 0.00 6.0 GX 354-0 262.996 -33.834 2.0 354.306 -0.155 5.7 0.41 13.9 0.0 0.00 0.0 3A 1822-371 276.420 -37.114 2.1 356.834 -11.277 7.5 0.59 12.7 1.9 0.47 4.1 4U 1722-30 261.859 -30.812 3.0 356.298 +2.313 3.4 0.38 8.8 1.5 0.30 5.1 GX 17+2 273.989 -14.043 2.6 16.419 +1.289 23.7 2.34 10.1 0.0 0.00 0.0 OAO 1657-415 255.181 -41.664 2.9 344.353 +0.328 17.4 1.94 9.0 0.0 0.00 0.0 GX 3+1 266.968 -26.565 2.9 2.285 +0.805 2.9 0.32 8.9 0.0 0.00 0.0 GRS 1741.9-2853 266.266 -28.959 0.0 359.917 +0.092 2.5 0.00 7.3 1.1 0.28 4.0 GX 9+1 270.350 -20.551 3.4 9.042 +1.170 3.6 0.47 7.5 0.0 0.00 0.0 SLX 1735-269 264.602 -27.036 3.9 0.775 +2.355 2.1 0.33 6.5 1.2 0.26 4.5 SLX 1744-299_300 266.859 -29.997 4.1 359.298 -0.889 2.2 0.35 6.2 0.0 0.00 0.0 3A 1728-169 262.920 -16.987 4.1 8.484 +9.036 5.7 0.93 6.1 0.0 0.00 0.0 XB 1832-330 278.876 -32.986 4.5 1.515 -11.326 3.3 0.59 5.6 0.0 0.00 0.0 HETE J1900.1-2455 284.962 -24.856 5.9 11.337 -12.786 10.1 2.42 4.1 0.0 0.00 0.0 SLX 1737-282 265.094 -28.277 4.9 359.955 +1.325 1.8 0.35 5.0 0.0 0.00 0.0 AX J1749.1-2733 267.348 -27.490 4.8 1.668 +0.038 1.8 0.34 5.2 0.0 0.00 0.0 4U 1735-444 264.738 -44.418 5.0 346.080 -6.974 14.6 2.95 5.0 0.0 0.00 0.0 IGR J17497-2821 267.302 -28.391 6.2 0.874 -0.391 1.3 0.00 3.9 0.0 0.00 0.0
JEM-X
JEM-X significance mosaic images. Left: 3-10 keV. Right: 10-25 keV.
Note: Sources labelled were detected with in the 3-10 keV image > 5σ and are listed in the table below. Fluxes are extracted at the known catalogue position of the source (i.e. no fitting of the source position is done), with mosaic_spec, in two bands: A = 3-10 keV (1 Crab ~ 88 cps); B = 10-25 keV (1 Crab ~ 32 cps).
NOTE: The object marked as SLX 1744-299_300 is used to indicate two low-mass x-ray binaries separated by 2.7 arcminutes, SLX 1744-299 and SLX 1744-300; the position for SLX 1744-299 is used, although it can not be ruled out that SLX 1744-300 may dominate the emission some of the time.
JEM-X Detected Sources in 3-10 keV (A) and 10-25 keV (B).
Source Name RA dec l b A(cps) +/- B(cps) +/- ==================== ======== ======== ======== ======== ====== ===== ====== ===== GX 3+1 266.983 -26.564 2.294 +0.794 31.3 0.72 4.3 0.36 GX 5-1 270.284 -25.079 5.077 -1.019 96.0 1.74 10.8 0.73
Go back to Bulge home page