INTEGRAL Galactic Bulge MonitoringRevolution 0659: Observation start 2008-03-06T12:43 = MJD 54531.53
Total Observation GTI = 13202 seconds
ISGRI
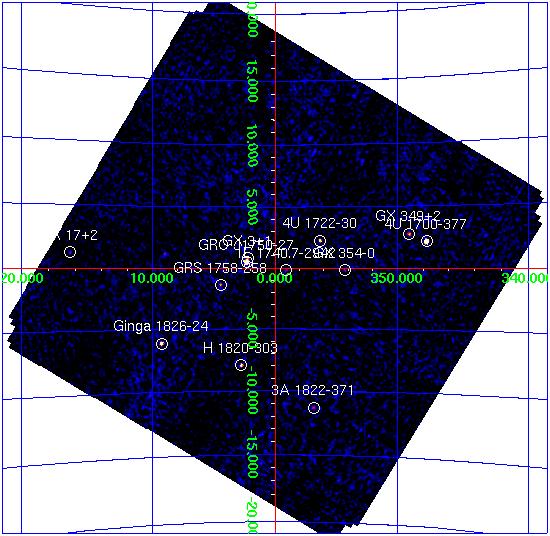
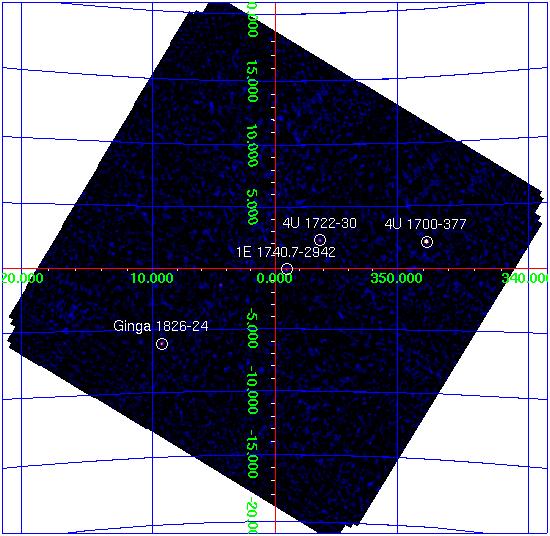
ISGRI significance mosaic images. Left: ISGRI 18-40 keV. Right: 40-100 keV
Sources detected > 10σ in each band are marked on the image. The table below lists the fitted position, and statistical positional uncertainty in arcmin returned by the mosaic step of OSA7, of all the sources detected in the 18 - 40 keV range (band A: 1 Crab ~ 206 cps ) and 40 - 100 keV range (band B: 1 Crab ~ 103 cps ) where available.
NOTES: The table is constructed from the isgri_mosa_res.fits file - fluxes in the mosaic output are known to be systematically ~10% lower than in the ScW light-curves (see known issues). The systematic noise increases towards the edge of the field of view and NEW sources < 6σ towards the border of the image may be spurious.
ISGRI Detected Sources 18-40 keV (A) and 40-100 keV (B)
Source Name             RA       dec   +/-    l        b     A(cps)  +/-   sig  B(cps)  +/-   sig
==================== ========  ======= === ======== ======== ====== ===== ===== ====== ===== =====
GRO J1750-27          267.294  -26.646 0.4    2.367   +0.514   36.6  0.30 120.3    1.5  0.24   6.2
4U 1700-377           255.993  -37.839 0.4  347.761   +2.173   65.6  0.68  97.1   17.5  0.50  34.7
Ginga 1826-24         277.365  -23.792 1.0    9.276   -6.084   18.5  0.58  31.7    6.8  0.44  15.4
H 1820-303            275.921  -30.352 1.1    2.797   -7.911   11.6  0.43  26.8    0.0  0.00   0.0
4U 1722-30            261.899  -30.809 1.3  356.319   +2.286    7.7  0.33  23.7    3.4  0.26  13.2
GX 349+2              256.428  -36.357 0.0  349.152   +2.793    8.6  0.00  15.4    0.0  0.00   0.0
GRS 1758-258          270.293  -25.743 2.1    4.504   -1.354    4.8  0.37  13.1    2.8  0.29   9.4
GX 3+1                266.952  -26.539 0.0    2.301   +0.831    3.7  0.00  12.4    0.0  0.00   0.0
3A 1822-371           276.458  -37.096 2.4  356.863  -11.297    6.4  0.58  11.0    0.0  0.00   0.0
1E 1740.7-2942        266.002  -29.772 2.6  359.103   -0.137    2.9  0.29  10.1    2.5  0.23  10.7
GX 354-0              262.973  -33.820 2.5  354.307   -0.131    3.8  0.36  10.7    0.0  0.00   0.0
GX 17+2               274.011  -14.043 2.5   16.428   +1.270   26.4  2.44  10.8    0.0  0.00   0.0
GX 9+1                270.359  -20.598 3.4    9.005   +1.140    3.4  0.45   7.6    0.0  0.00   0.0
SLX 1735-269          264.556  -26.939 3.3    0.836   +2.441    2.4  0.00   7.8    1.2  0.25   4.8
GX 1+4                263.071  -24.716 4.1    1.992   +4.764    2.4  0.38   6.2    0.0  0.00   0.0
GX 5-1                270.234  -25.035 4.4    5.093   -0.957    2.1  0.37   5.7    0.0  0.00   0.0
1RXS J163759.7-26062  249.468  -26.066 4.3  353.512  +13.865   11.9  2.04   5.8    0.0  0.00   0.0
1RXS J165424.7-29541  253.620  -29.825 3.1  352.903   +8.648    4.8  0.57   8.4    0.0  0.00   0.0
NEW_1                 255.522  -26.264 3.3  356.799   +9.482    4.2  0.54   7.8    0.0  0.00   0.0
NEW_2                 254.785  -25.348 4.0  357.139  +10.563    3.9  0.61   6.4    0.0  0.00   0.0
NEW_3                 281.874  -24.789 4.1   10.201  -10.211    8.4  1.35   6.2    0.0  0.00   0.0
NEW_4                 268.296  -26.601 4.3    2.863   -0.234    1.8  0.31   5.8    0.0  0.00   0.0
NEW_5                 280.956  -34.169 3.7    1.149  -13.393    6.0  0.86   6.9    0.0  0.00   0.0
NEW_6                 267.139  -27.031 0.0    1.965   +0.433    1.9  0.00   6.3    0.0  0.00   0.0
NEW_7                 283.492  -35.064 0.0    1.147  -15.664    9.6  0.00   6.2    0.0  0.00   0.0
NEW_8                 260.258  -35.162 4.1  351.944   +0.975    2.7  0.44   6.1    0.0  0.00   0.0
NEW_9                 255.313  -17.629 4.5    3.822  +14.724    5.7  1.03   5.5    0.0  0.00   0.0
NEW_10                275.827  -38.823 4.4  355.055  -11.594    3.8  0.67   5.7    0.0  0.00   0.0
NEW_11                254.112  -36.693 4.6  347.744   +4.057    4.1  0.74   5.5    0.0  0.00   0.0
** NOTE ** : A telemetry gap at beginning of REV 0659 means that ISGRI detector plane calibration data (context table) was not received correctly. This affects the low threshold of the NRT data and is responsible for the large number of NEW sources, which are spurious. The problem should be corrected in the Consolidated data.
JEM-X
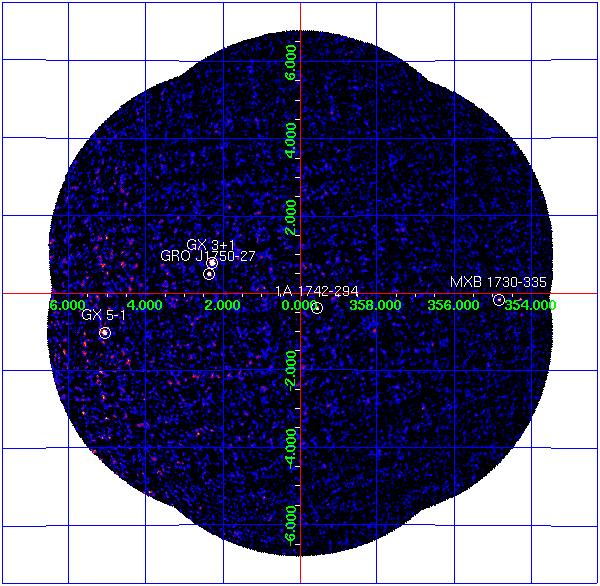
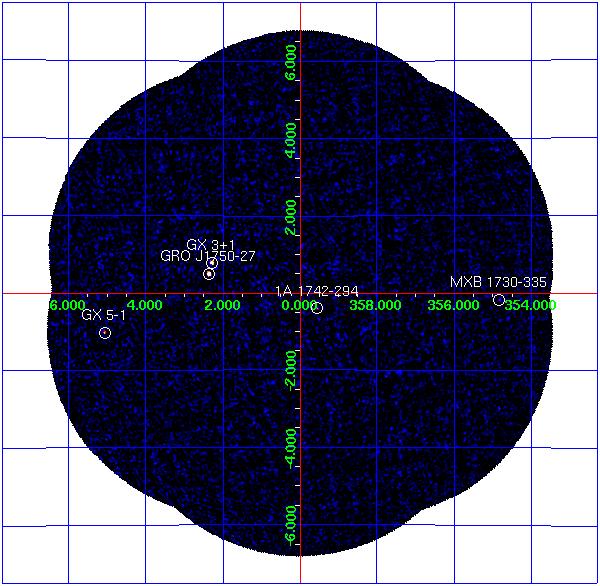
JEM-X significance mosaic images. Left: 3-10 keV. Right: 10-25 keV.
Note: Sources labelled were detected in the 3-10 keV image > 5σ and are listed in the table below. Fluxes are extracted at the known catalogue position of the source (i.e. no fitting of the source position is done), with mosaic_spec, in two bands: A = 3-10 keV (1 Crab ~ 88 cps); B = 10-25 keV (1 Crab ~ 32 cps).
NOTE: The object marked as SLX 1744-299_300 is used to indicate two low-mass x-ray binaries separated by 2.7 arcminutes, SLX 1744-299 and SLX 1744-300; the position for SLX 1744-299 is used, although it can not be ruled out that SLX 1744-300 may dominate the emission some of the time.
JEM-X Detected Sources in 3-10 keV (A) and 10-25 keV (B).
Source Name             RA      dec       l        b     A(cps)  +/-  B(cps)  +/-
==================== ======== ======== ======== ======== ====== ===== ====== =====
MXB 1730-335          263.350  -33.388  354.841   -0.158    8.7  1.20    1.8  0.77
1A 1742-294           266.523  -29.515  359.559   -0.389    3.1  0.35    0.6  0.20
GX 3+1                266.983  -26.564    2.294   +0.794   37.0  0.66    5.1  0.35
GX 5-1                270.284  -25.079    5.077   -1.019   69.6  2.22    4.9  1.03
GRO J1750-27          267.303  -26.643    2.373   +0.508   11.2  0.60    9.2  0.36
Go back to Bulge home page
Revolution 0659: Observation start 2008-03-06T12:43 = MJD 54531.53
Total Observation GTI = 13202 seconds
ISGRI
ISGRI significance mosaic images. Left: ISGRI 18-40 keV. Right: 40-100 keV
Sources detected > 10σ in each band are marked on the image. The table below lists the fitted position, and statistical positional uncertainty in arcmin returned by the mosaic step of OSA7, of all the sources detected in the 18 - 40 keV range (band A: 1 Crab ~ 206 cps ) and 40 - 100 keV range (band B: 1 Crab ~ 103 cps ) where available.
NOTES: The table is constructed from the isgri_mosa_res.fits file - fluxes in the mosaic output are known to be systematically ~10% lower than in the ScW light-curves (see known issues). The systematic noise increases towards the edge of the field of view and NEW sources < 6σ towards the border of the image may be spurious.
ISGRI Detected Sources 18-40 keV (A) and 40-100 keV (B)
Source Name RA dec +/- l b A(cps) +/- sig B(cps) +/- sig ==================== ======== ======= === ======== ======== ====== ===== ===== ====== ===== ===== GRO J1750-27 267.294 -26.646 0.4 2.367 +0.514 36.6 0.30 120.3 1.5 0.24 6.2 4U 1700-377 255.993 -37.839 0.4 347.761 +2.173 65.6 0.68 97.1 17.5 0.50 34.7 Ginga 1826-24 277.365 -23.792 1.0 9.276 -6.084 18.5 0.58 31.7 6.8 0.44 15.4 H 1820-303 275.921 -30.352 1.1 2.797 -7.911 11.6 0.43 26.8 0.0 0.00 0.0 4U 1722-30 261.899 -30.809 1.3 356.319 +2.286 7.7 0.33 23.7 3.4 0.26 13.2 GX 349+2 256.428 -36.357 0.0 349.152 +2.793 8.6 0.00 15.4 0.0 0.00 0.0 GRS 1758-258 270.293 -25.743 2.1 4.504 -1.354 4.8 0.37 13.1 2.8 0.29 9.4 GX 3+1 266.952 -26.539 0.0 2.301 +0.831 3.7 0.00 12.4 0.0 0.00 0.0 3A 1822-371 276.458 -37.096 2.4 356.863 -11.297 6.4 0.58 11.0 0.0 0.00 0.0 1E 1740.7-2942 266.002 -29.772 2.6 359.103 -0.137 2.9 0.29 10.1 2.5 0.23 10.7 GX 354-0 262.973 -33.820 2.5 354.307 -0.131 3.8 0.36 10.7 0.0 0.00 0.0 GX 17+2 274.011 -14.043 2.5 16.428 +1.270 26.4 2.44 10.8 0.0 0.00 0.0 GX 9+1 270.359 -20.598 3.4 9.005 +1.140 3.4 0.45 7.6 0.0 0.00 0.0 SLX 1735-269 264.556 -26.939 3.3 0.836 +2.441 2.4 0.00 7.8 1.2 0.25 4.8 GX 1+4 263.071 -24.716 4.1 1.992 +4.764 2.4 0.38 6.2 0.0 0.00 0.0 GX 5-1 270.234 -25.035 4.4 5.093 -0.957 2.1 0.37 5.7 0.0 0.00 0.0 1RXS J163759.7-26062 249.468 -26.066 4.3 353.512 +13.865 11.9 2.04 5.8 0.0 0.00 0.0 1RXS J165424.7-29541 253.620 -29.825 3.1 352.903 +8.648 4.8 0.57 8.4 0.0 0.00 0.0 NEW_1 255.522 -26.264 3.3 356.799 +9.482 4.2 0.54 7.8 0.0 0.00 0.0 NEW_2 254.785 -25.348 4.0 357.139 +10.563 3.9 0.61 6.4 0.0 0.00 0.0 NEW_3 281.874 -24.789 4.1 10.201 -10.211 8.4 1.35 6.2 0.0 0.00 0.0 NEW_4 268.296 -26.601 4.3 2.863 -0.234 1.8 0.31 5.8 0.0 0.00 0.0 NEW_5 280.956 -34.169 3.7 1.149 -13.393 6.0 0.86 6.9 0.0 0.00 0.0 NEW_6 267.139 -27.031 0.0 1.965 +0.433 1.9 0.00 6.3 0.0 0.00 0.0 NEW_7 283.492 -35.064 0.0 1.147 -15.664 9.6 0.00 6.2 0.0 0.00 0.0 NEW_8 260.258 -35.162 4.1 351.944 +0.975 2.7 0.44 6.1 0.0 0.00 0.0 NEW_9 255.313 -17.629 4.5 3.822 +14.724 5.7 1.03 5.5 0.0 0.00 0.0 NEW_10 275.827 -38.823 4.4 355.055 -11.594 3.8 0.67 5.7 0.0 0.00 0.0 NEW_11 254.112 -36.693 4.6 347.744 +4.057 4.1 0.74 5.5 0.0 0.00 0.0
** NOTE ** : A telemetry gap at beginning of REV 0659 means that ISGRI detector plane calibration data (context table) was not received correctly. This affects the low threshold of the NRT data and is responsible for the large number of NEW sources, which are spurious. The problem should be corrected in the Consolidated data.
JEM-X
JEM-X significance mosaic images. Left: 3-10 keV. Right: 10-25 keV.
Note: Sources labelled were detected in the 3-10 keV image > 5σ and are listed in the table below. Fluxes are extracted at the known catalogue position of the source (i.e. no fitting of the source position is done), with mosaic_spec, in two bands: A = 3-10 keV (1 Crab ~ 88 cps); B = 10-25 keV (1 Crab ~ 32 cps).
NOTE: The object marked as SLX 1744-299_300 is used to indicate two low-mass x-ray binaries separated by 2.7 arcminutes, SLX 1744-299 and SLX 1744-300; the position for SLX 1744-299 is used, although it can not be ruled out that SLX 1744-300 may dominate the emission some of the time.
JEM-X Detected Sources in 3-10 keV (A) and 10-25 keV (B).
Source Name RA dec l b A(cps) +/- B(cps) +/- ==================== ======== ======== ======== ======== ====== ===== ====== ===== MXB 1730-335 263.350 -33.388 354.841 -0.158 8.7 1.20 1.8 0.77 1A 1742-294 266.523 -29.515 359.559 -0.389 3.1 0.35 0.6 0.20 GX 3+1 266.983 -26.564 2.294 +0.794 37.0 0.66 5.1 0.35 GX 5-1 270.284 -25.079 5.077 -1.019 69.6 2.22 4.9 1.03 GRO J1750-27 267.303 -26.643 2.373 +0.508 11.2 0.60 9.2 0.36
Go back to Bulge home page